Device → dashboard streaming
BlinkPose™ is a family of small, self-contained modules that each take one physical device and stream its live data to a local web dashboard — a depth camera, a motion-capture rig, your keyboards and joysticks, a handful of BLE motion and pressure boards, a motorized force platform, a flatbed scanner, a body scale or a blood pressure monitor. Same message shape, same look, no build step.
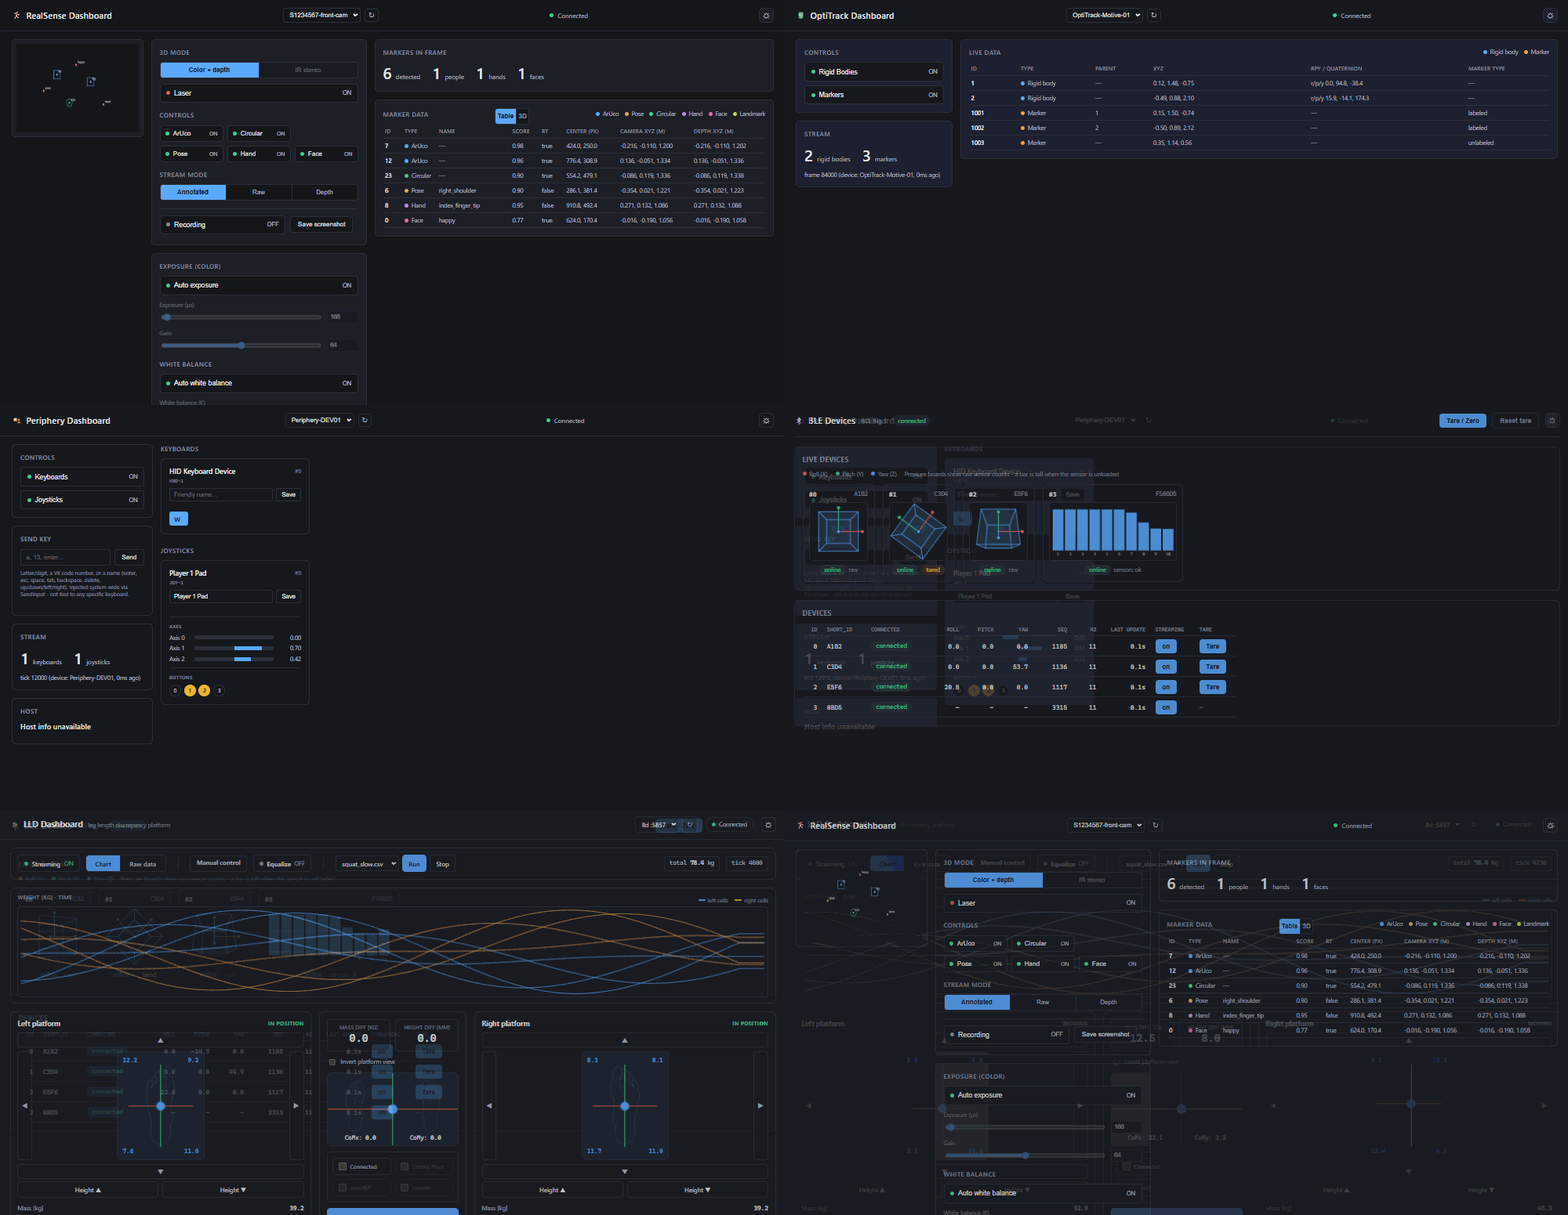
All nine dashboards — in turn: depth camera, motion capture, input hardware, BLE boards, scale and blood pressure, force platform, remote screen, clock sync, scanner. Each is a static page served from the module's own process.
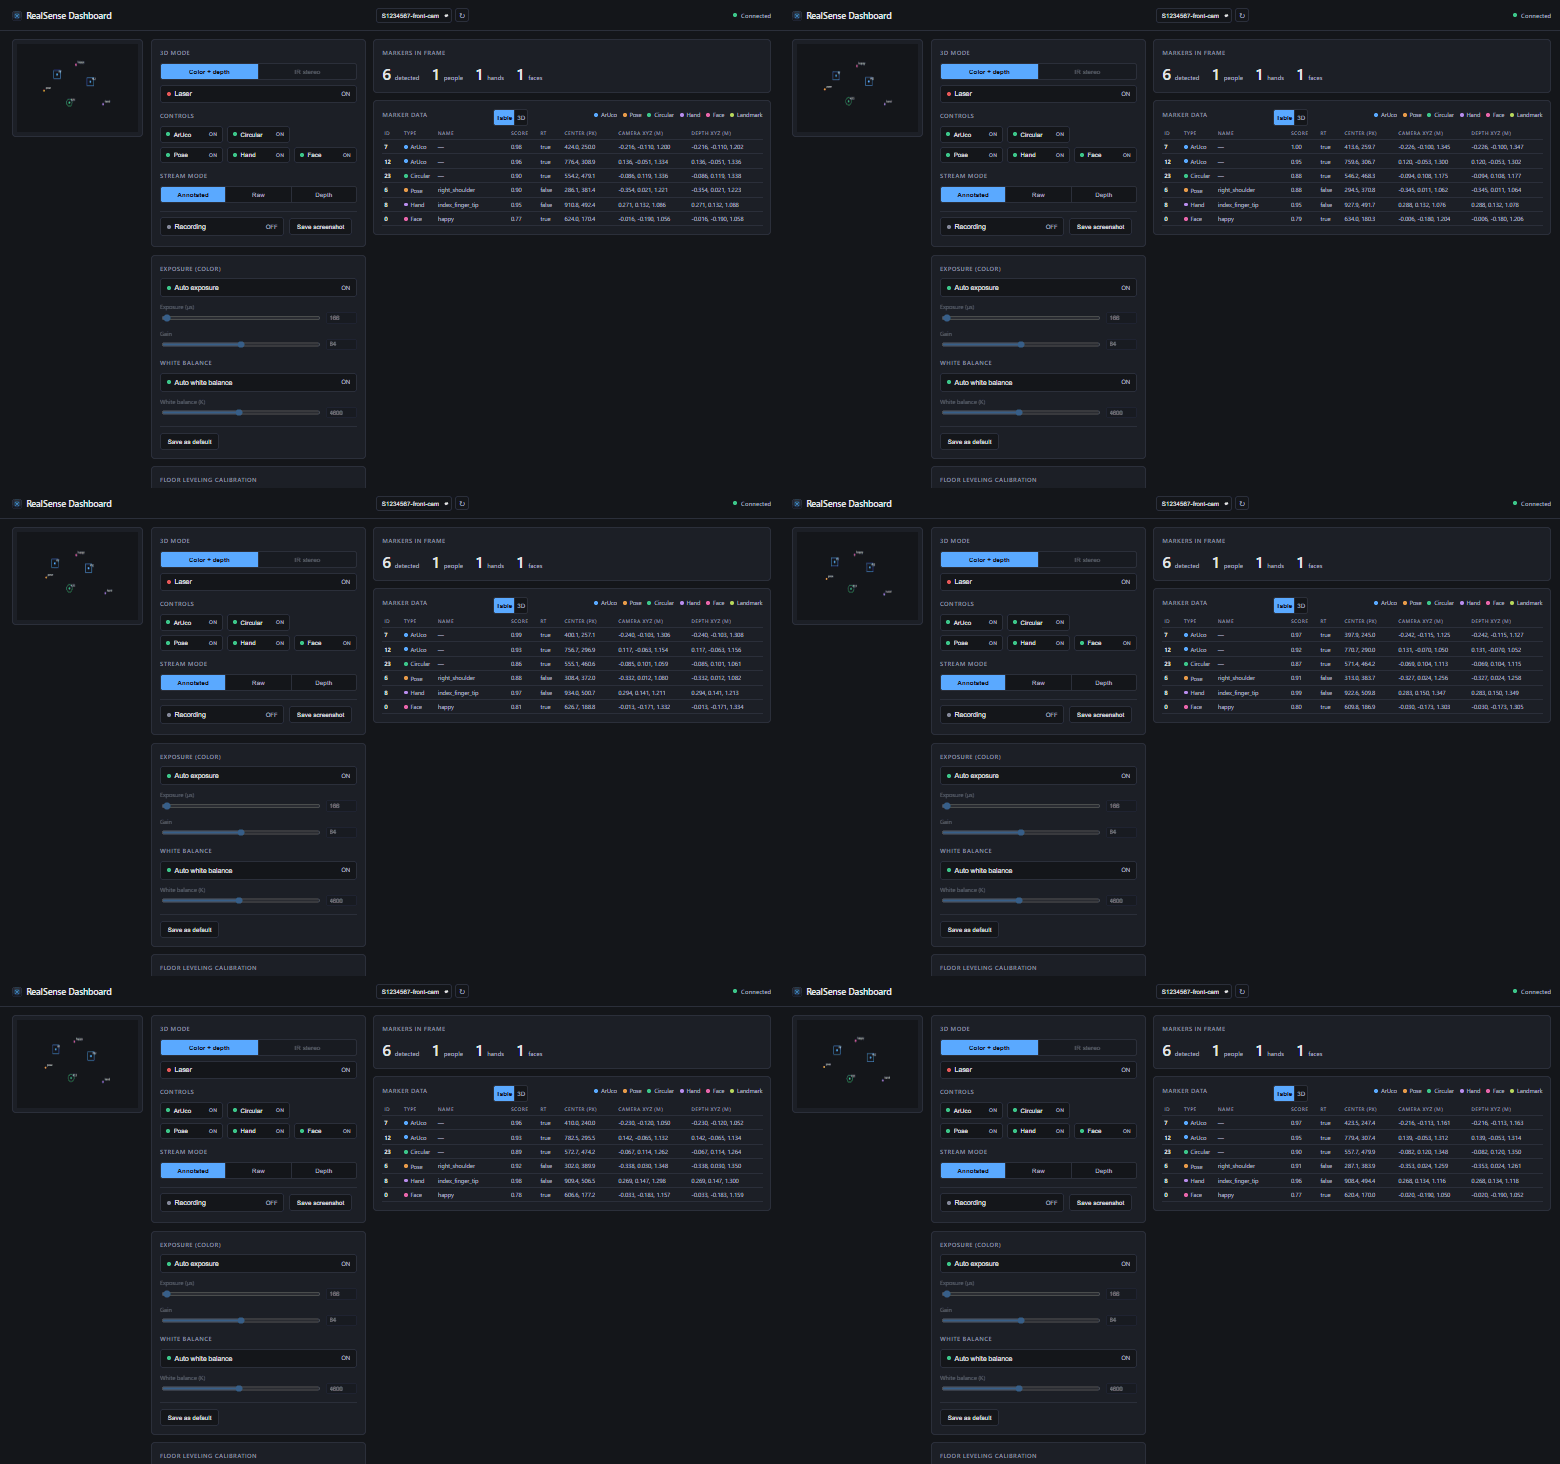
Each module runs a tight loop: poll, detect, build one message per tick, push it out. Run several at once for several devices.
Every module speaks the same { timestamp, device_id, entries[] } envelope. Learn one client, read them all.
Static index.html + style.css + script.js. They discover a running instance by probing localhost.
One shared set of design tokens behind every dashboard — dark by default, light a click away, and the whole family reads as one product in either.
The family
Each module is a shipped, working implementation of the same idea, adapted to what its device actually produces.
Track dashboard — live camera feed, the detection table, and the in-browser 3D view of everything in frame.
The richest module. It runs computer vision on an Intel RealSense depth camera, detecting ArUco markers, full-body pose down to the feet, both hands finger by finger, faces and circular markers in a single pass — each tagged with a real 3D position deprojected from the depth stream, and a full 6-DOF pose for the marker types. It's the only module with a live video feed and an in-browser 3D view of everything it sees, and it can record and replay sessions.
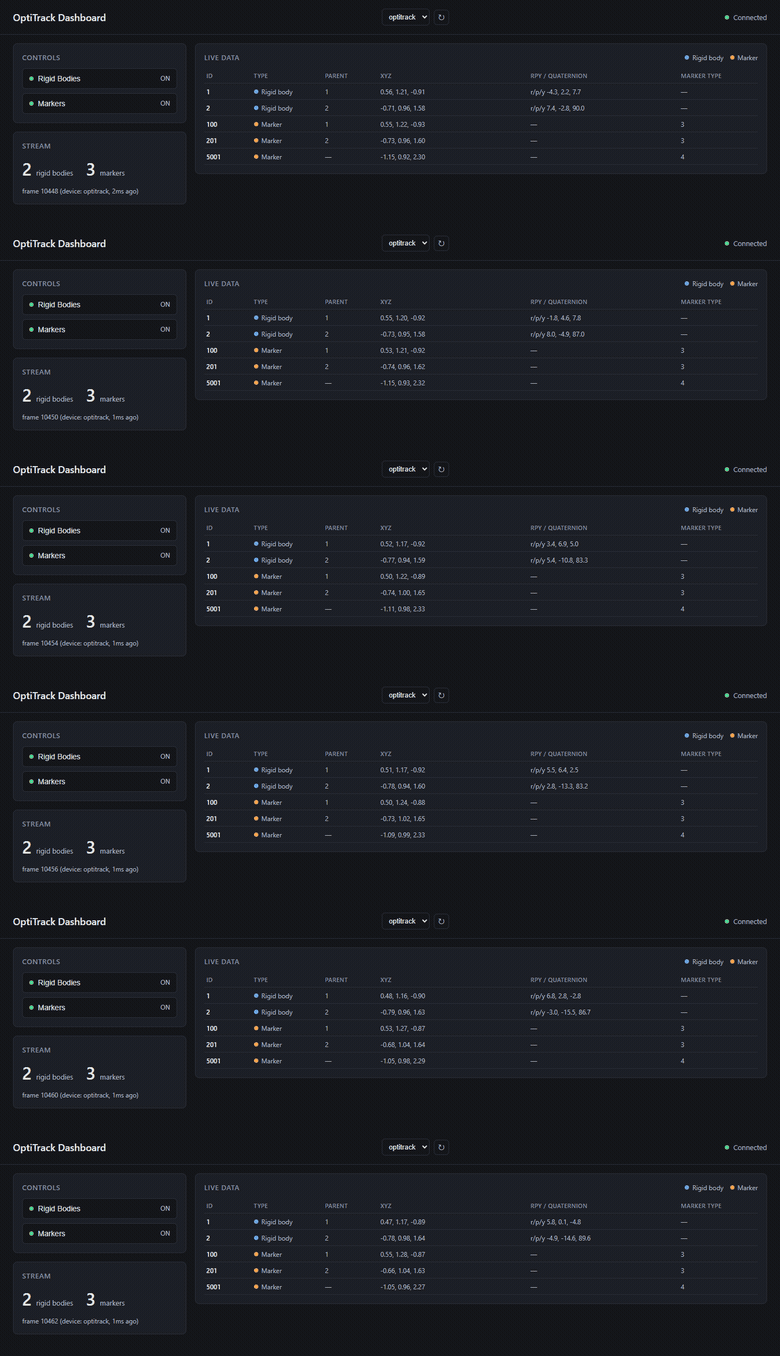
OptiTrack dashboard — tracked rigid bodies and their individual markers, straight from the mocap solver.
Bridges a professional OptiTrack / Motive motion-capture rig over NatNet. It streams every tracked rigid body with full 6-DOF pose plus its individual markers, straight from the mocap solver — already in millimetre-accurate 3D, so there's no depth math to do. Each frame carries the solver's own frame id, so anything downstream lines up exactly with the capture.
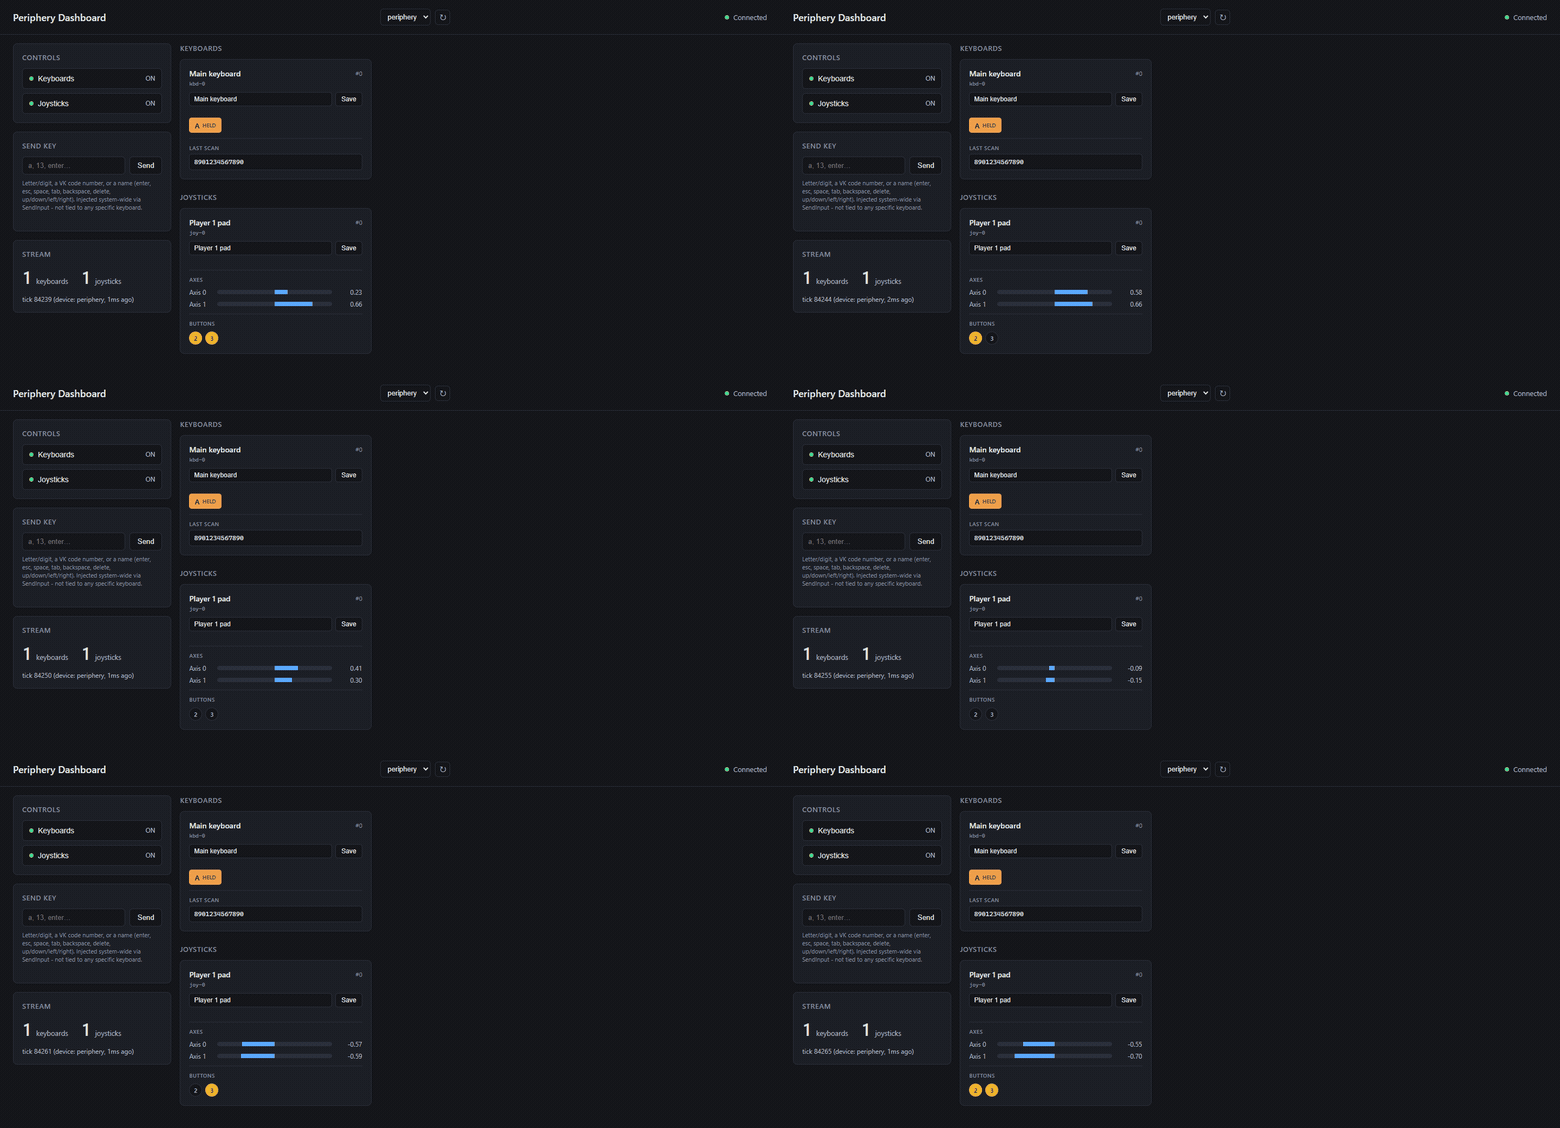
Periphery dashboard — the roster of connected keyboards and joysticks, axes and buttons updating live.
Turns ordinary input hardware into a clean data stream. It reports key presses per physical keyboard through Win32 Raw Input — so it can even tell two identical keyboards apart — plus joystick axes and buttons over SDL2. It keeps a live roster of every connected device (each with an editable friendly name), and can inject synthetic keystrokes back out to the OS.
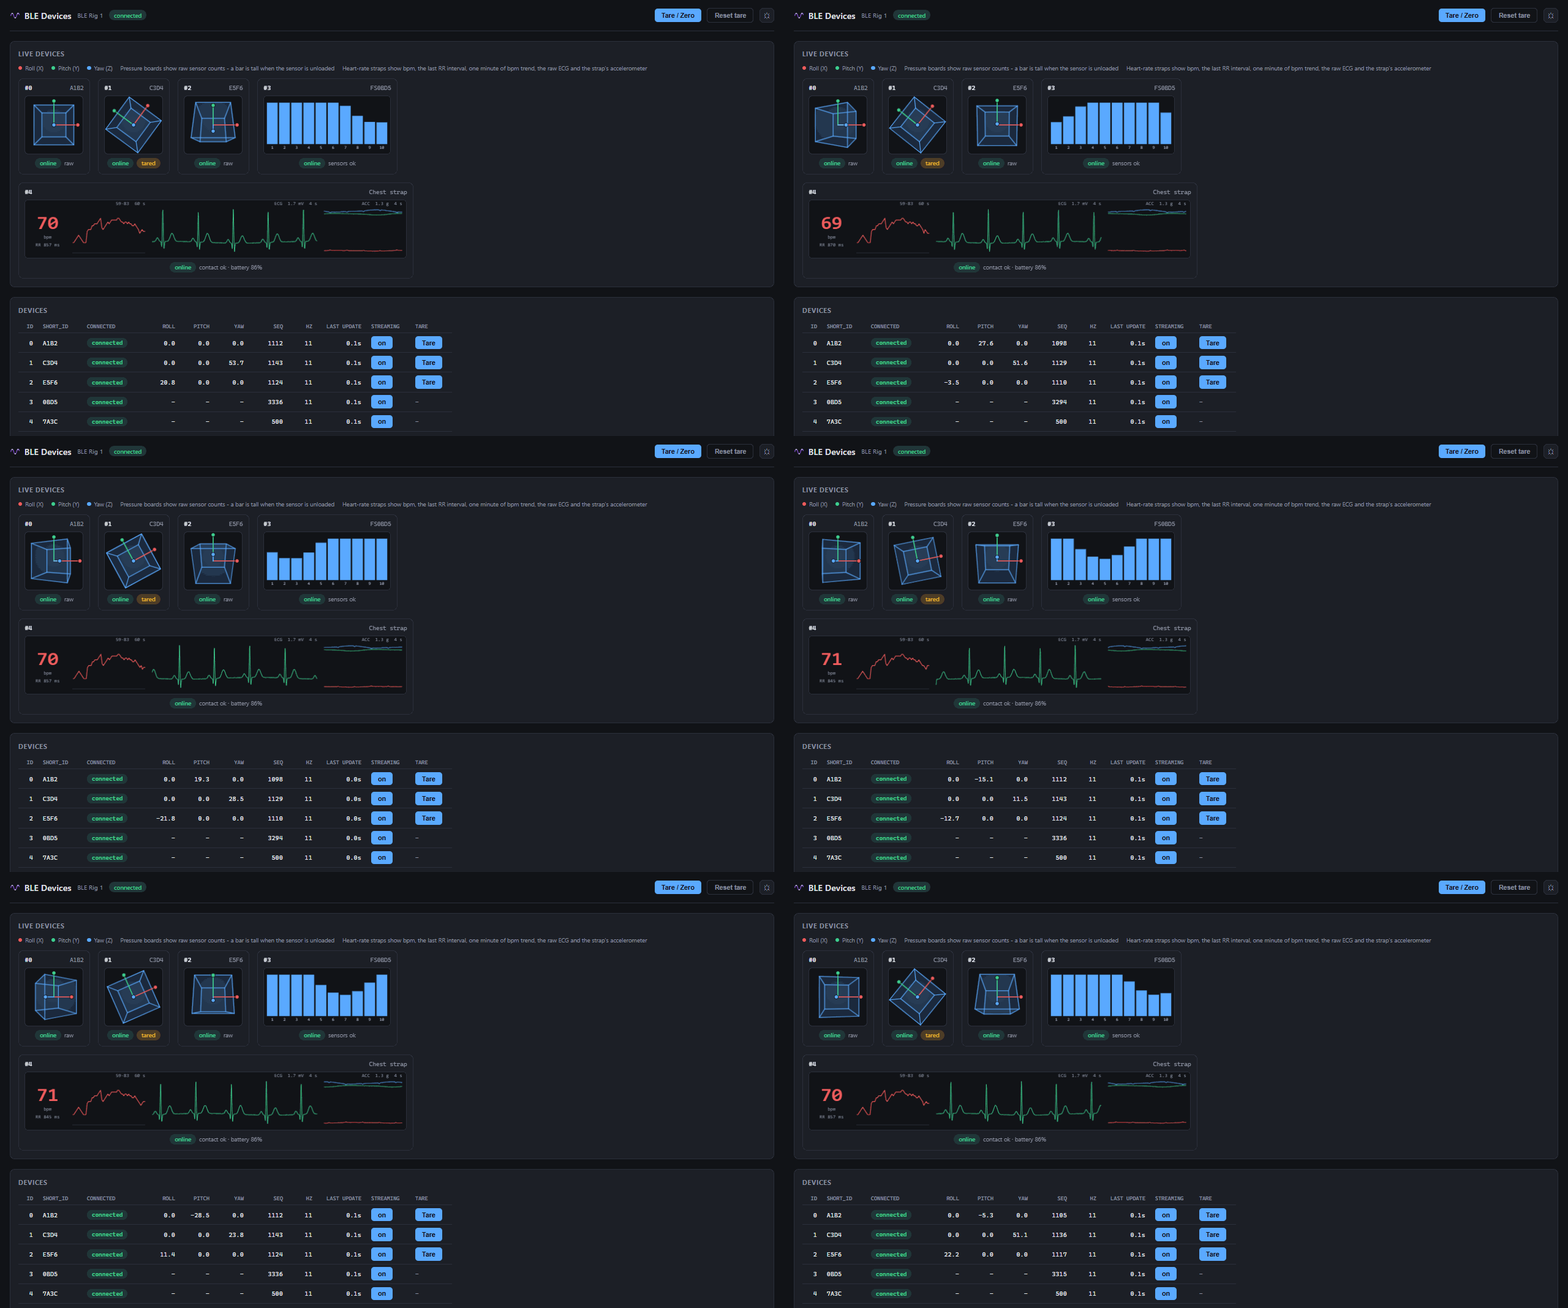
BLE dashboard — orientation boards, pressure boards and a chest strap side by side: tareable 3D gizmos, ten-channel sensor bars, and heart rate with a live ECG trace.
Connects over Bluetooth LE to a mixed set of small wireless devices at once — IMU boards republishing a fused orientation quaternion, pressure boards republishing ten live load channels each, and a chest strap republishing heart rate, RR intervals and its raw ECG trace. Because the devices are small and wireless, it's the natural fit for wearables, props and mats — and you can tare any orientation board straight from the dashboard, capturing its current pose as a new zero reference on the fly.
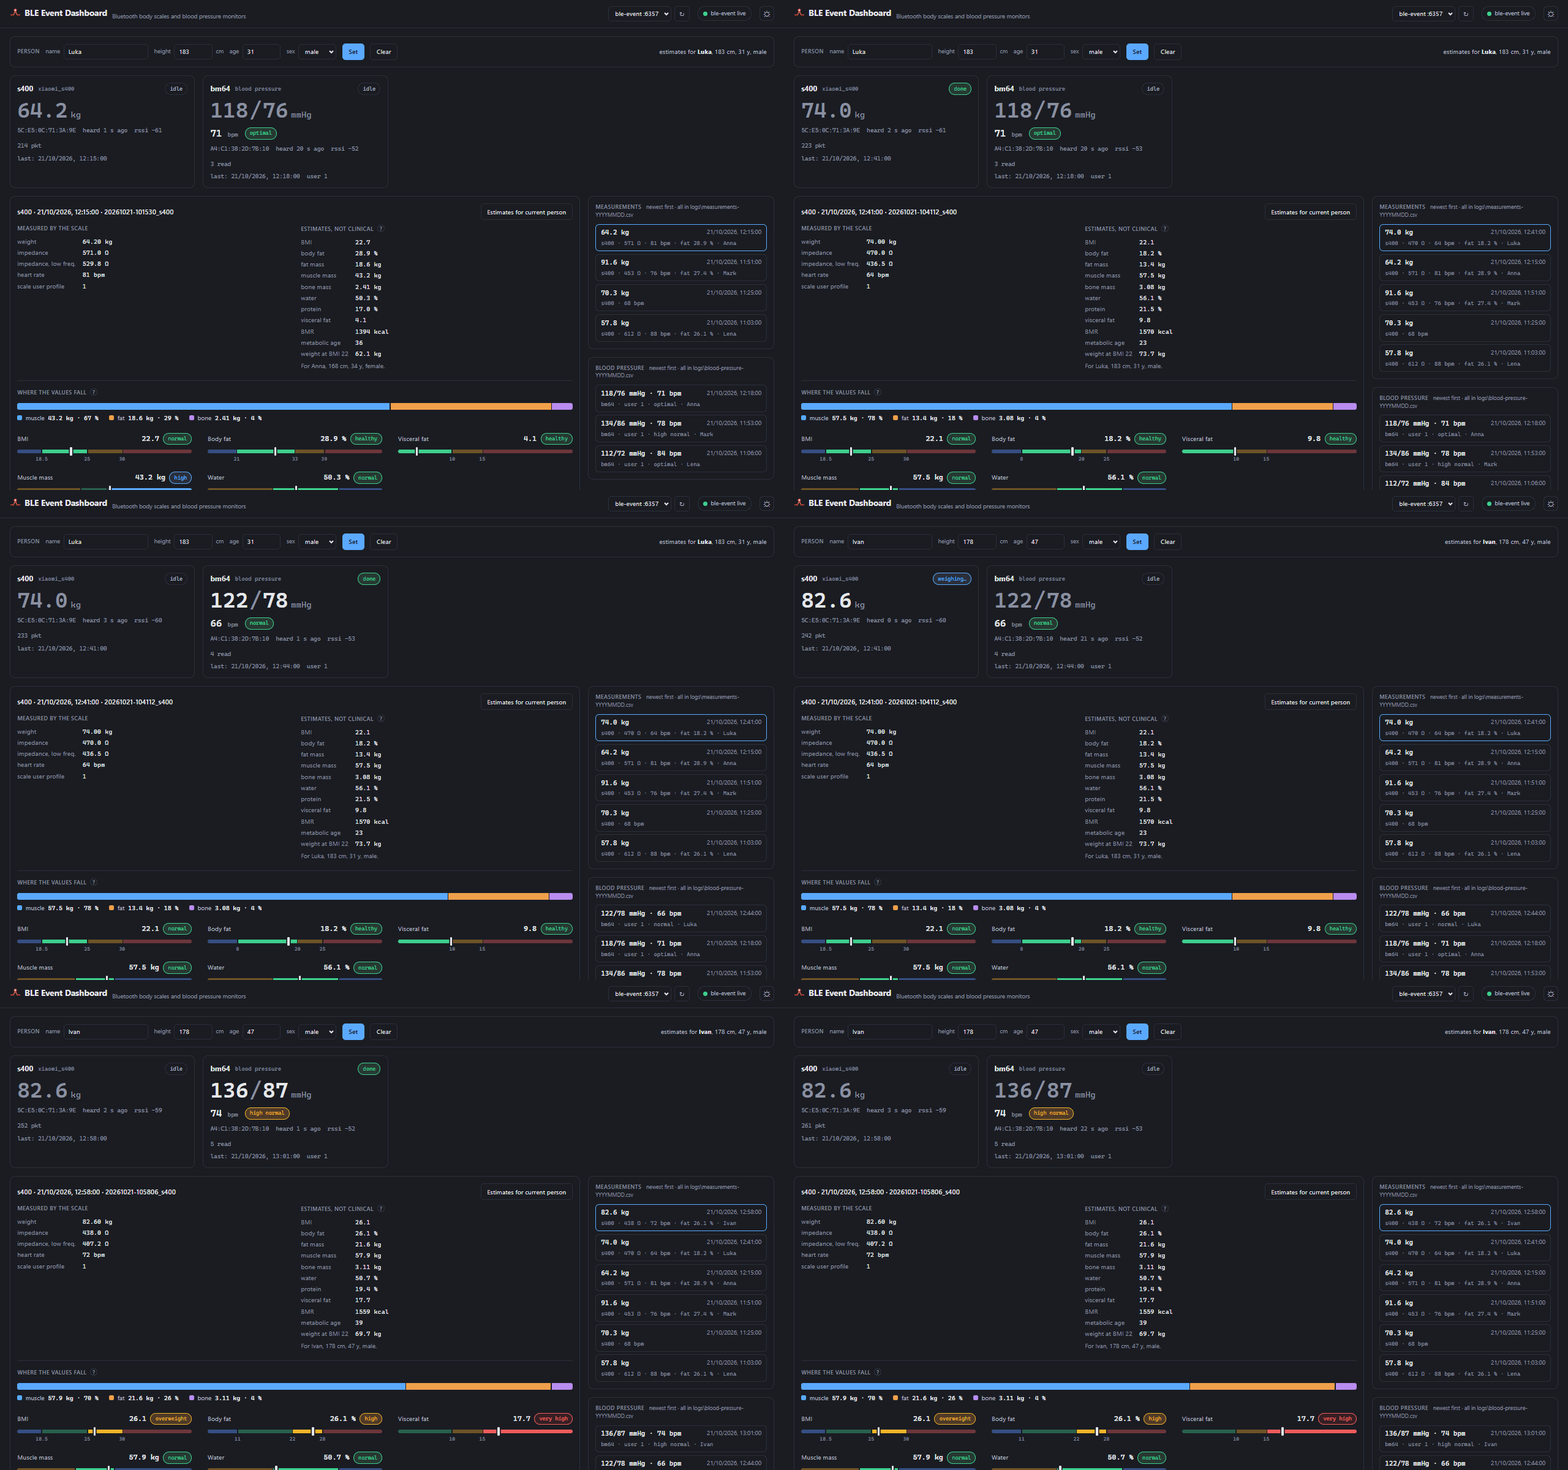
BLE Event dashboard — two people in turn: the scale sends each finished weighing, and it lands in the history with what the scale measured, the estimates for that person, and coloured bands that show where each value falls. After each weighing a blood pressure reading arrives the same way.
A consumer body-composition scale as a data source: weight, bioimpedance and heart rate, read straight from its Bluetooth broadcasts — no phone, no app, no cloud. Every weighing is logged, and with the person's height, age and sex the module adds the body-composition estimates the scale's app would show, clearly marked as estimates. A Bluetooth blood pressure monitor is read the same way: each reading arrives by itself a few seconds after it is taken.
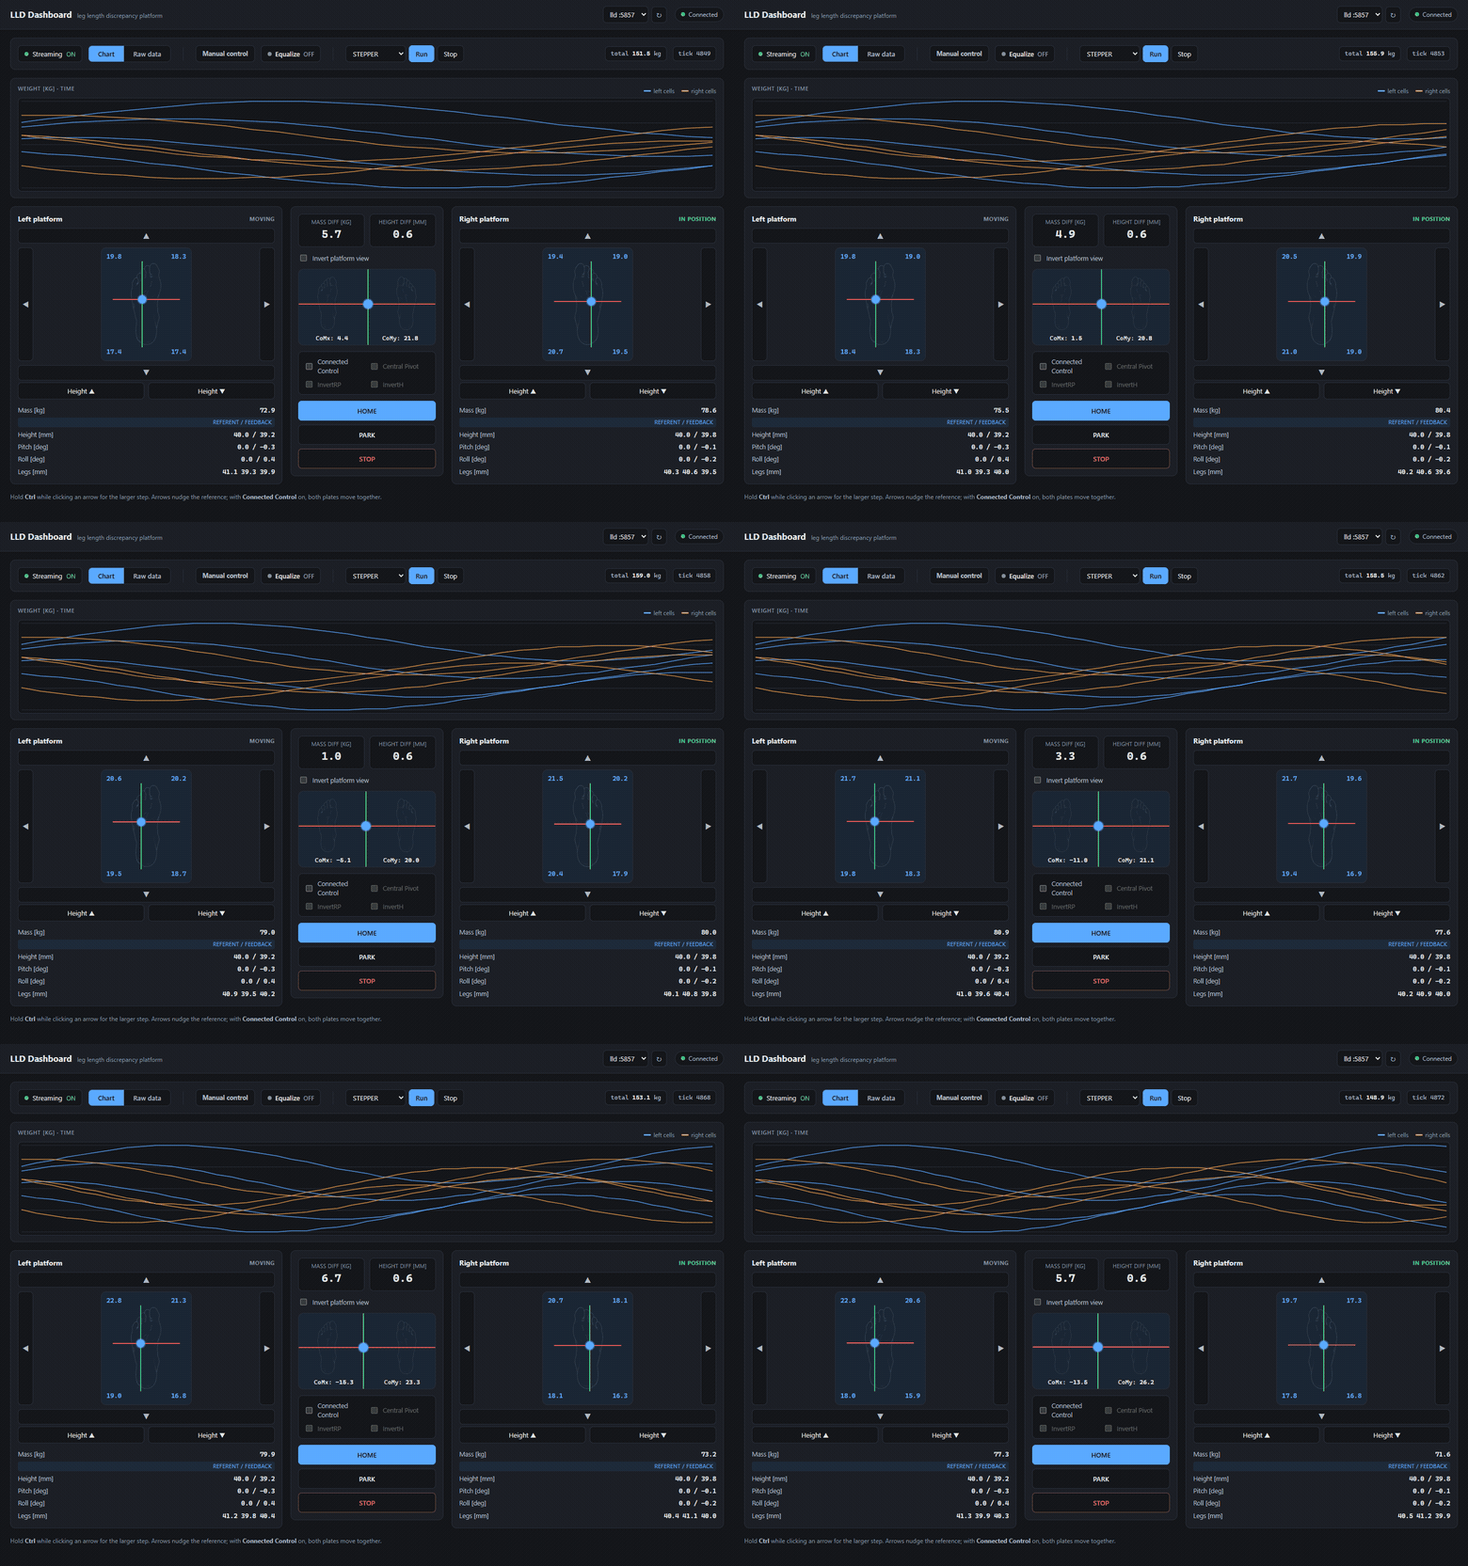
LLD dashboard — eight load cells, six actuators, and the controls that drive both plates.
The one device that talks back. A leg-length-discrepancy platform with two motorized foot plates — it streams 8 load cells, 6 actuators and each plate's live pose, and it also takes motion commands, driving the plates to a target height, roll and pitch straight from the browser.
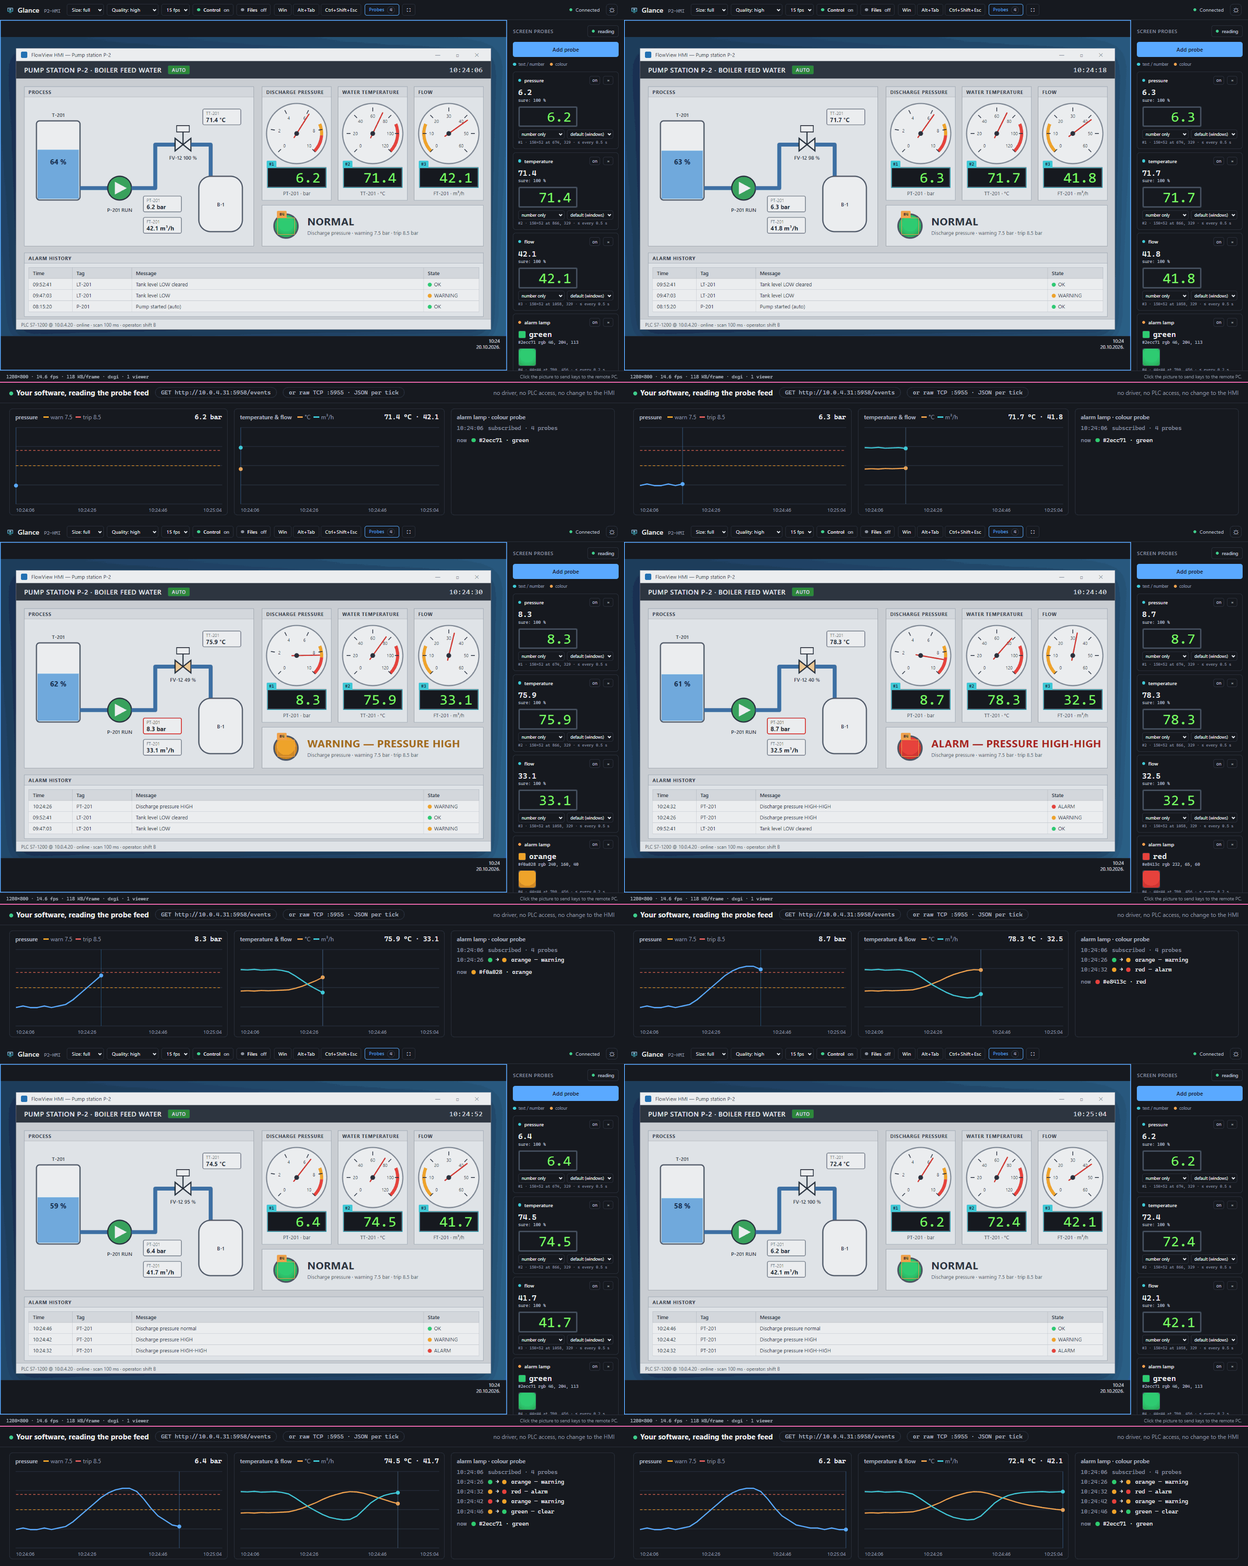
Glance viewer — a pump-station HMI on another PC, in the browser. Four probes read its gauges' readouts and its alarm lamp; below, a client plots that feed as the pressure trips the alarm and recovers.
Turns the numbers on a machine's screen into live data: mark a rectangle on an HMI, an instrument's software or a legacy program, and Glance publishes the text, number or colour it sees there — no driver, no PLC access, no change to the program. Around it, a full remote desktop in any browser on the network, with mouse and keyboard control and copy-paste of files and text, to set the probes up and keep an eye on the machine.
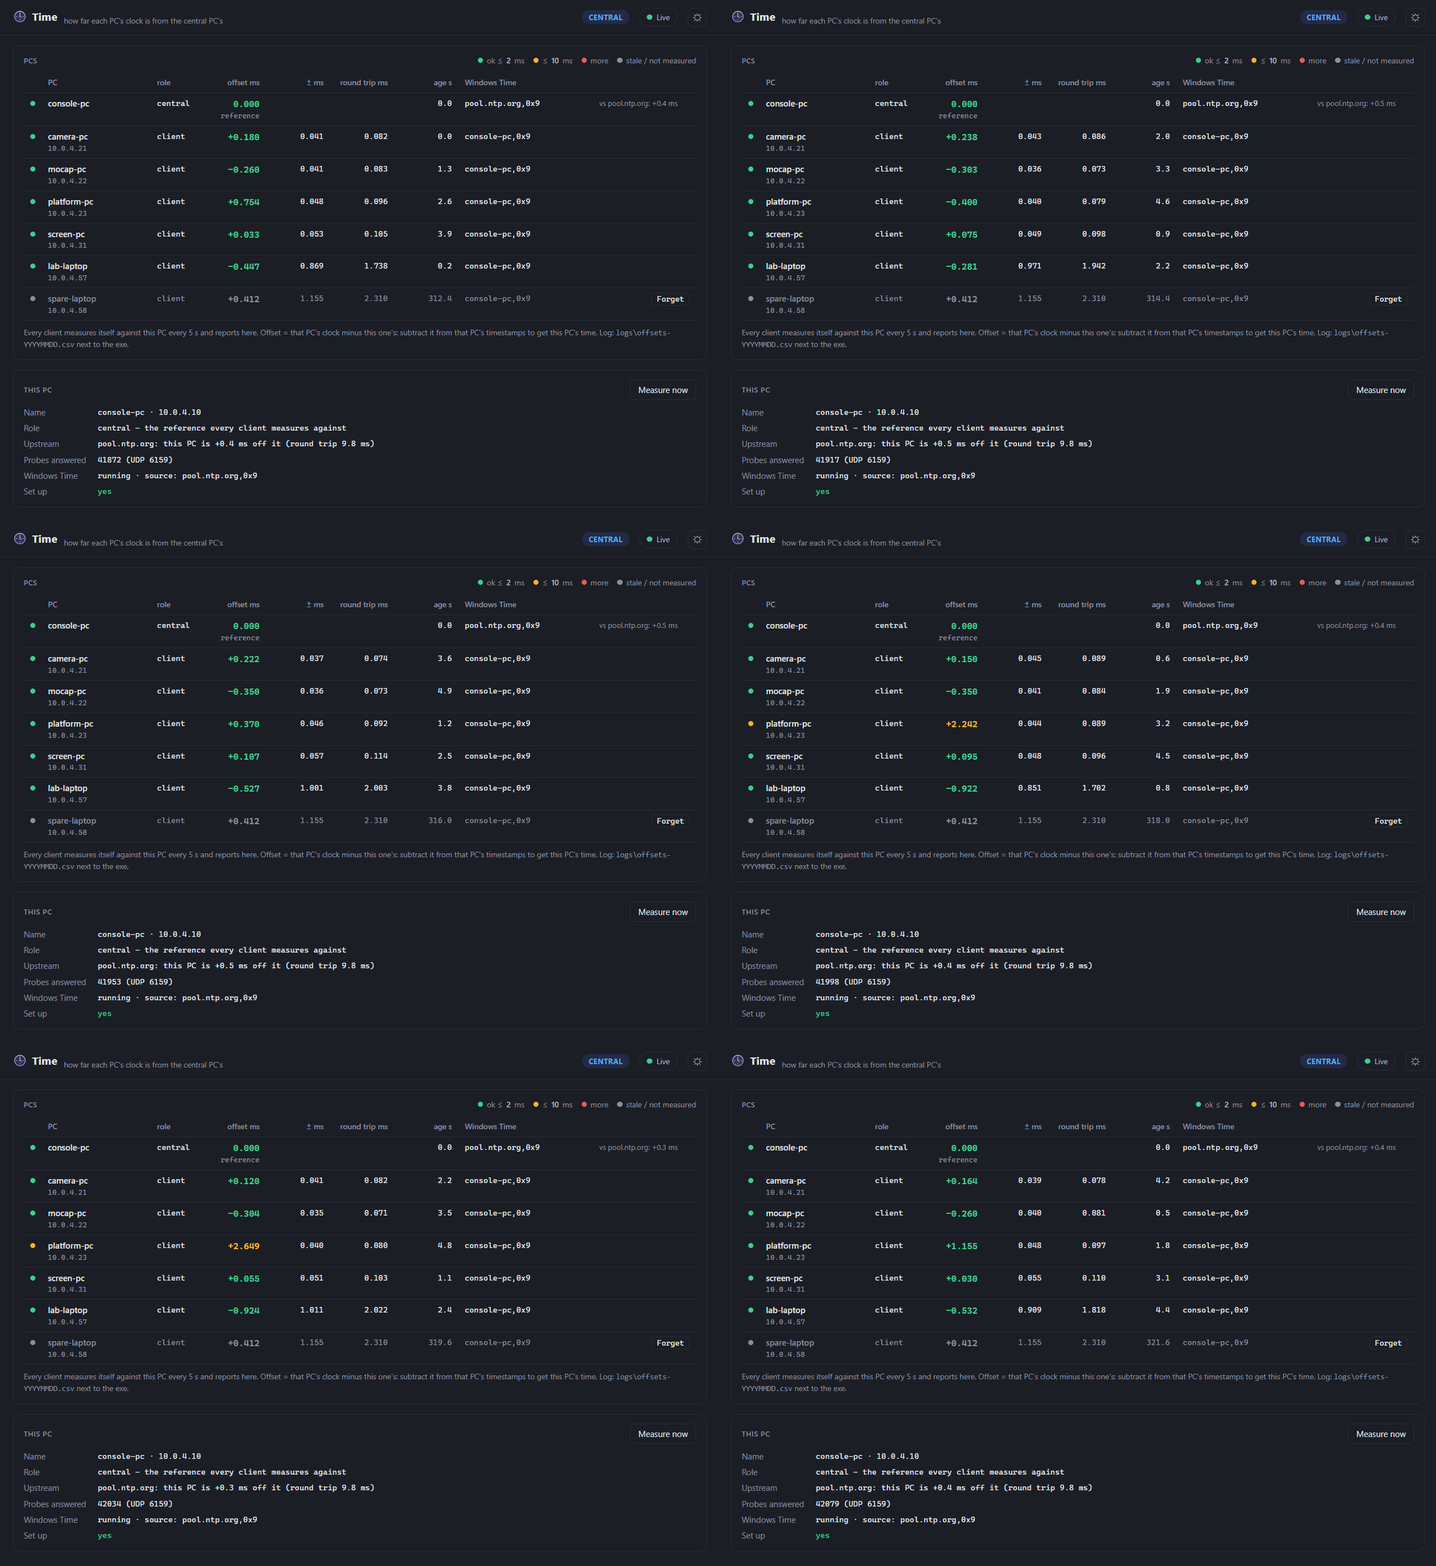
Time dashboard — the central PC's table: every PC's clock offset, measured every five seconds; one drifts past 2 ms and is pulled back.
For a setup spread over several PCs — a camera on one, the platform on another. Time keeps every PC's clock in step with one central PC through Windows' own time service, and checks every few seconds how far each really is from it, to a fraction of a millisecond. The other modules stay as they are: their timestamps simply line up.
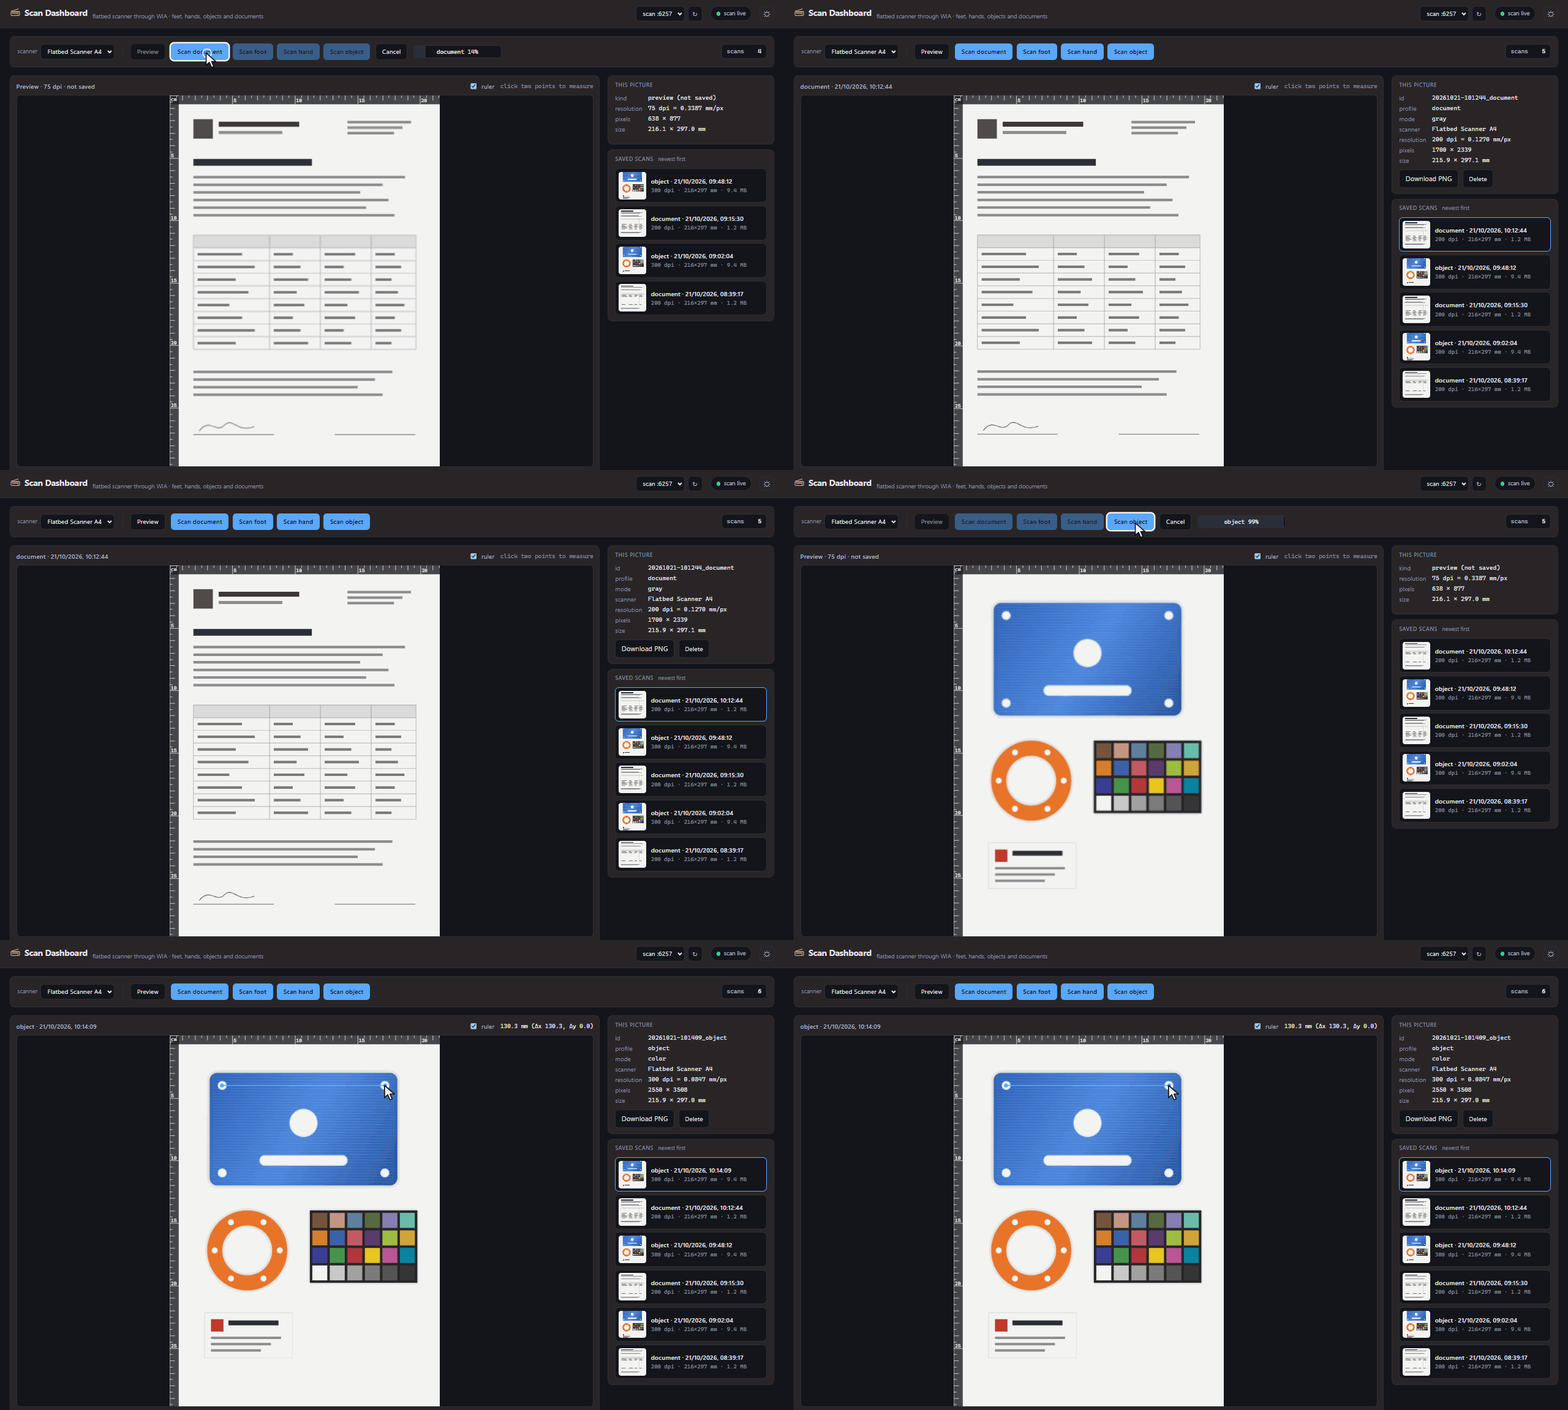
Scan dashboard — first a form, scanned in grey; then a colour scan of parts at 300 dpi, the plate's hole spacing measured in millimetres with two clicks.
Any ordinary flatbed scanner Windows knows, as a measuring device on the network: documents, parts, samples and other objects — or, in a clinic, feet and hands. Each kind of scan is a profile of its own, and every scan is saved with its true resolution, so each pixel has a size in millimetres: measure on it right in the dashboard, print it 1:1, or let your software read it.
Under the hood
One process owns one device. It runs four tiny network servers, and the browser dashboard finds it by probing localhost — no configuration handshake, no central registry.
Signal path — one process owns one device and answers on four consecutive ports; the dashboard finds it by probing localhost.
/status with a device_id is a live instance.entries[] list, discriminated by type and sorted deterministically, drawn into a live table (and, for Track, a 3D view).GET calls to the control API, which always returns the full current /status.{
"timestamp_ms": 1730563200123,
"device_id": "optitrack",
"entries": [
{
"type": "rigidbody",
"id": 1,
"rt": [ /* row-major 4×4 pose */ ]
},
{
"type": "marker",
"id": 101,
"parent_id": 1,
"rt": null
}
]
}
One envelope type per tick · entries[] sent even when empty · id = parent_id·100 + index.
Consistent by design
The pieces that make nine independent apps feel like one system.
Every dashboard starts from a byte-identical :root token block — one accent, a green/red/amber status set, and no rule outside that block naming a colour. The light theme re-states the same names, so one attribute re-skins all nine.
left half dark · right half light
Open a dashboard and it discovers the running process by itself, probing localhost — nothing to type in, no address to configure. Start the process, open the page, and it just connects.
GET /status → device_id ✓
Every module serializes the same { timestamp_ms, device_id, entries[] } envelope, with a single type-discriminated entries[] list — read one module and you can read them all.